온라인 광고 클릭수 분석하기
기본 데이터 불러오기
data1 <- read.csv(url('http://stat.columbia.edu/~rachel/datasets/nyt1.csv'))
ggplot 설치하기
> install.packages('ggplot2')
> library(ggplot2)
히스토그램(막대그래프) 그리기
x = x 축 변수, fill = 누적 막대 그래프를 위한 y 값의 그룹/분류 , geom_histogrm = 막대그래프 형식, binwidth = x축 눈금 범위
> ggplot(data1, aes(x=Impressions, fill=agecut))+geom_histogram(binwidth = 1)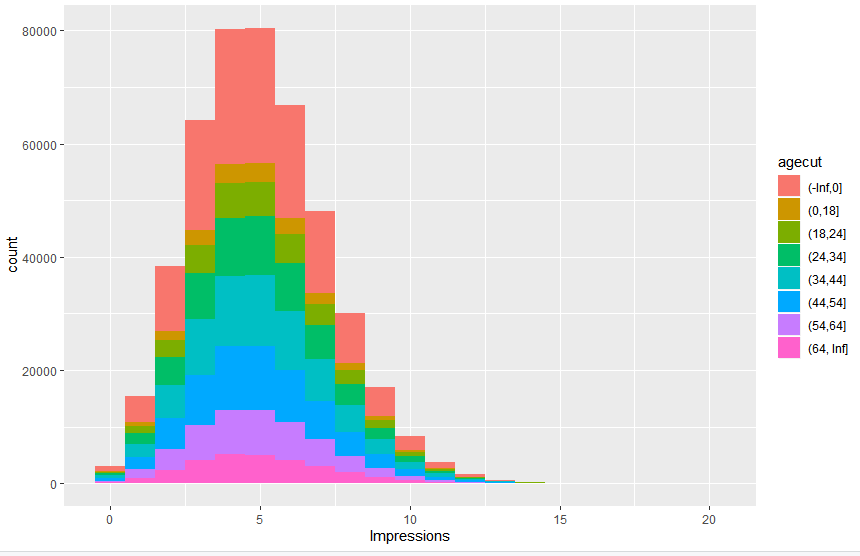
상자 그래프 boxplot 그리기
x = x축 변수, y=y축 변수, fill=y 값의 분류, geom_boxplot() : 상자그래프
> ggplot(data1, aes(x=agecut, y=Impressions, fill=agecut))+geom_boxplot()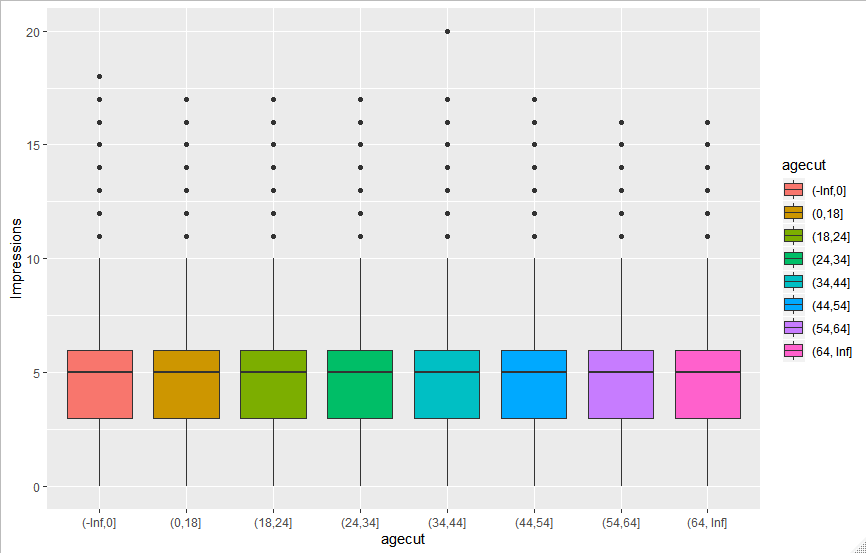
밀도 함수 그래프 그리기
subset : 데이터 중 clicks의 값이 0보다 큰 것만 추리기
> ggplot(subset(data1, Clicks>0), aes(x=Clicks/Impressions, color=agecut))+geom_density()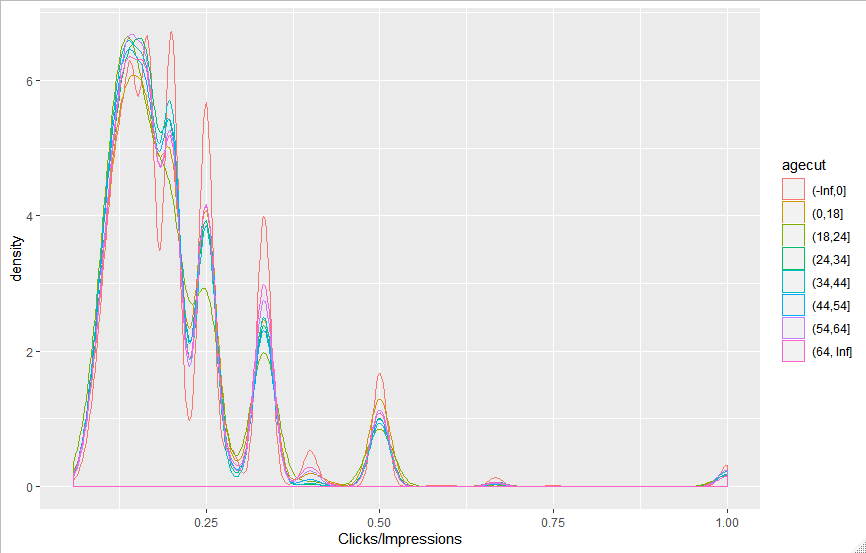
반응형